Underappreciated builtin: Grand Unified Debugger
~1089 words. ~5 minutes.
Table of Contents
Or as I would like to call it, GLORIOUS Unified Debugger.
This is my submission for June's Emacs Carnival, Underappreciated Emacs built-ins.
You can find detailed information in the excellent documentation at (info "(emacs) Debuggers").
Multi debugger support
I mostly use its GDB Graphical Interface. But it supports multiple debuggers such as,
lldb(LLVM debugger)perldb(Perl debugger)jdb(Java debugger)pdb(Python debugger)guiler(Guile!)dbx(Debugger with support for C, C++, and so.)xdb(Debugger for MS Windows (?))sdb(System Debugger)
The GDB interface
The manual has a entire section of the special GDB GUI interface. Which I will illustrate now.
This is our demo source file: fibo.c,
#include <stdio.h>

int
fibo (int n)
{
  if (n < 2)
    return 1;
  else
    return fibo (n - 1) + fibo (n - 2);
}

int
main (void)
{
  for (int i = 0; i < 5; i++)
    printf ("%d: %d\n", i, fibo(i));
}
Firstly, we compile via,
gcc -g fibo.c -o fibo
(The -g flag is necessary for debugging with GDB.)
Now that we have a compiled program, we can try executing it.
./fibo
0: 1
1: 1
2: 2
3: 3
4: 5
Now we can proceed with starting gdb gud in Emacs. To do so, we type
M-x gdb RET fibo RET, and this creates a buffer called *gud-fibo*.
Current directory is /home/tusharhero/Documents/c-scratch/
GNU gdb (GDB) 17.2
Copyright (C) 2025 Free Software Foundation, Inc.
License GPLv3+: GNU GPL version 3 or later <http://gnu.org/licenses/gpl.html>
This is free software: you are free to change and redistribute it.
There is NO WARRANTY, to the extent permitted by law.
Type "show copying" and "show warranty" for details.
This GDB was configured as "x86_64-unknown-linux-gnu".
Type "show configuration" for configuration details.
For bug reporting instructions, please see:
<https://www.gnu.org/software/gdb/bugs/>.
Find the GDB manual and other documentation resources online at:
    <http://www.gnu.org/software/gdb/documentation/>.

For help, type "help".
Type "apropos word" to search for commands related to "word"...
Reading symbols from fibo...
(gdb)
Though we won't be directly using this CLI interface, you can use it if you want to.
Let's set some breakpoints.
Yup, you can just click on the fringe (the place left to the text),
and automatically set up the breakpoints, which show up like so in
*gud-fibo*.
Breakpoint 1 at 0x401138: file fibo.c, line 7.
Breakpoint 2 at 0x40113f: file fibo.c, line 9.
Breakpoint 3 at 0x401174: file fibo.c, line 16.
(gdb)
Now, we will start debugging by running the program.
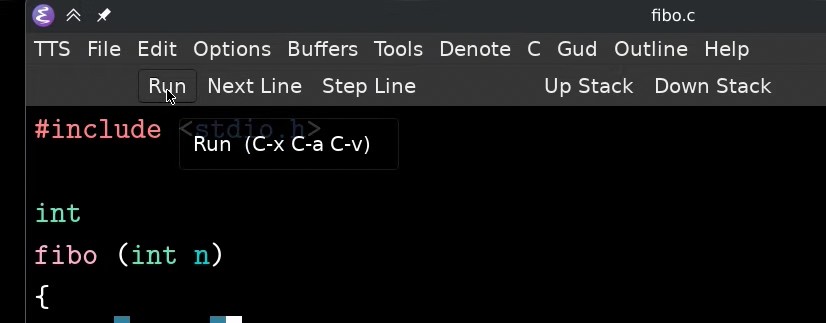
These buttons: Run, Next Line, Step Line, Up Stack, and Down Stack are
part of the tool bar.
And immediately it stops at the first breakpoint it encounters, (breakpoint 3). The white arrow represents the current line that is being executed.
![]()
Now we can step into fibo function by using Step Line.
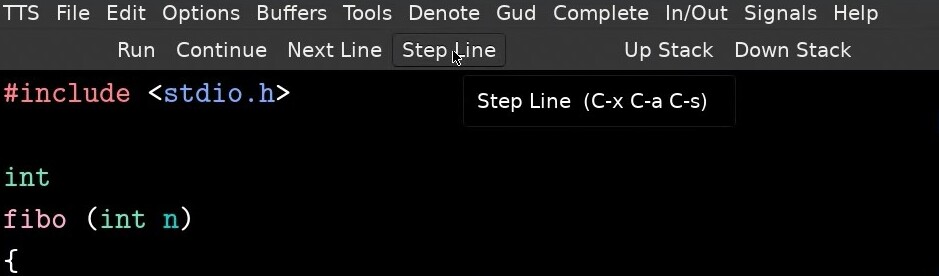
Notice that we also have a new button for Continue now, which
continues until the next break point is hit. So, let us turn off the
breakpoint in the for loop. For this we will use the dedicated
breakpoints management window.
Now let's just spam the continue button a bunch of times.
And since we are calling printf in the for loop, there is a pop out
dedicated window for I/O. (Notice that it is not just for output).
Well what if I want to see what the value of n is currently? There are actually a bunch of ways to look at that.
Here you just kinda put your cursor over the thing you want to get the value of … and you just get it? :)
The other way to use to the locals window,
But then who wants to keep track of this manually? Let's just watch the variable, so that we get update whenever it changes.
Closing
I would like to cover many other features, but I unfortunately don't have the time to get through all of them, maybe I will write a sort-of sequel covering more features and other debuggers supported by GUD.